Major Functions |
Analytic Approaches |
|
|
Full-text Search
|
|
|
|
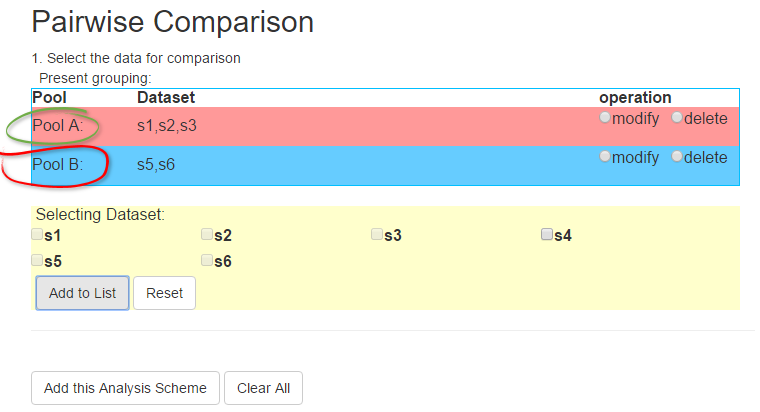
Library Comparison
|
|
|
|
|
|
|
|
Import GeneList
|
|
|
|
|
|
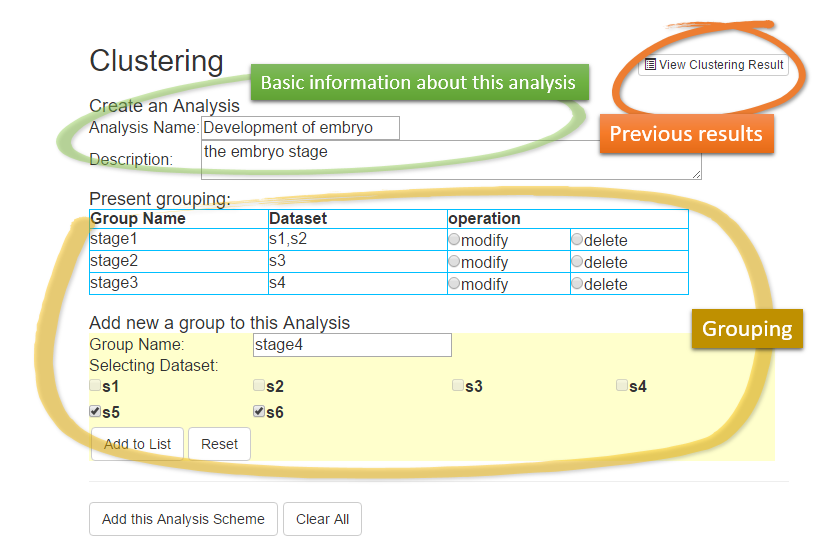
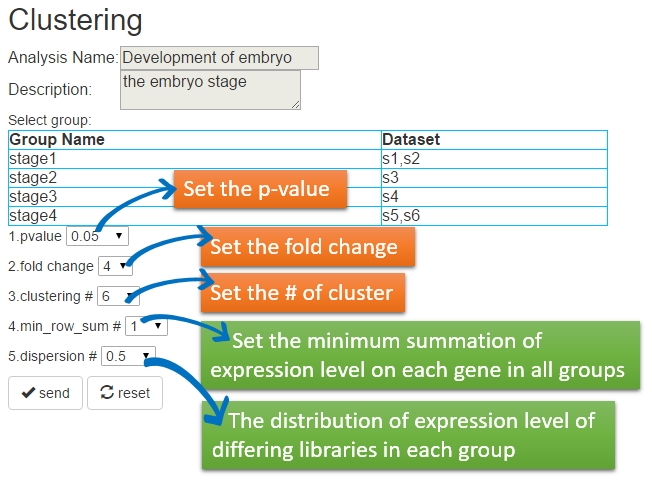
Clustering
|
|
|
|
|
|
|
|
|
|
|
KEGG GlobalView
|
|
|
|
Gene List Analysis
|
|
|
|
Approaches for Deep Analysis
|
|
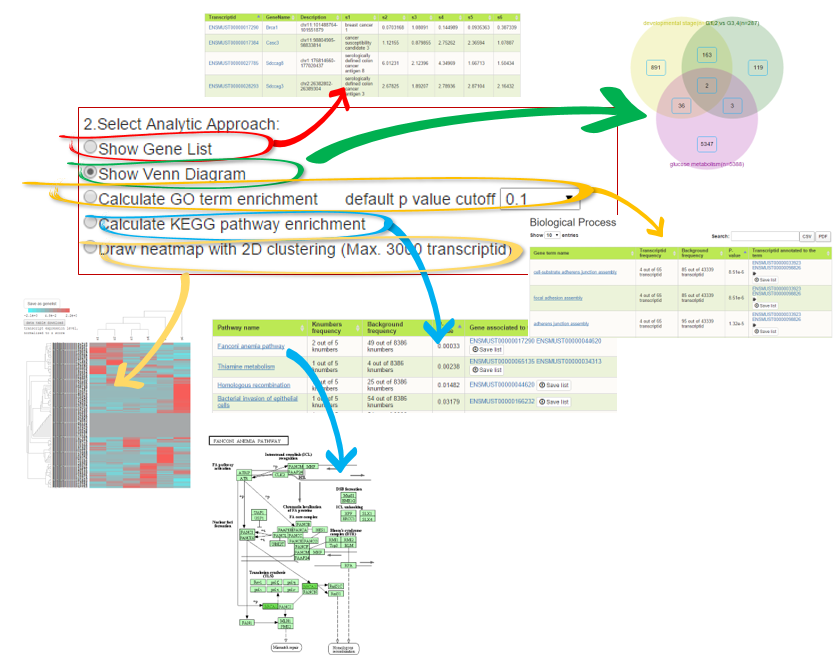
In MOLAs, five major analytic approaches are ready for online analyses. |
|
|
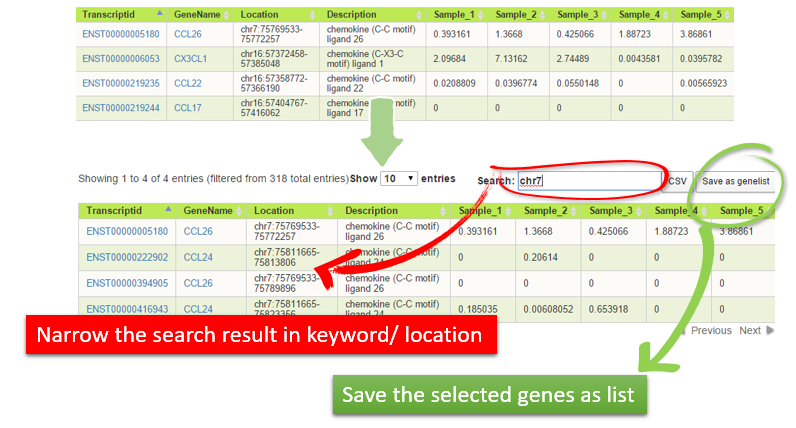
Show Gene list
|
| Just list the genes generated from various approaches. User also can perform the search with keyword or location like "chr7" in the case below to narrow down the search output. Of course, all the output can be saved as new gene list for deep analysis. |
 |
Show Venn Diagram
|
| By selecting more than two gene lists, the logical operation can be performed to get the specific genes and selected as new list for further analysis. |
 |
Calculate GO term enrichment
|
| After set the value of P-value, user can reveal the possible functions inside the gene list in Biological Process, Molecular Function and Cellular Component. And the genes annotated with specific GO term can be saved as new gene list for further analysis. |
 |
Calculate KEGG pathway enrichment
|
| Similar to the function with GO term enrichment, user can click name of pathway to see the regulatory relationship. Meanwhile, clicking the rectangle box in the pathway will show the expressed level for those genes shared the same KEGG Orthology (KO). And those genes belonged to specific pathway can be saved as list for further analysis. |
 |
Draw heatmap with 2D clustering
|
| A Heat map is a graphical representation of data where the expressed levels of each sample contained in a matrix are shown as colors. Sometime the number of genes in Heatmap is nore than hundreds, it shows as a black bar and is hard to read. Here we can roll the mouse wheel to zoom in the list and select those genes with interest as new gene list for further analysis. |
 |
| Lastest update 2022/1/17 |