Full-text Search 
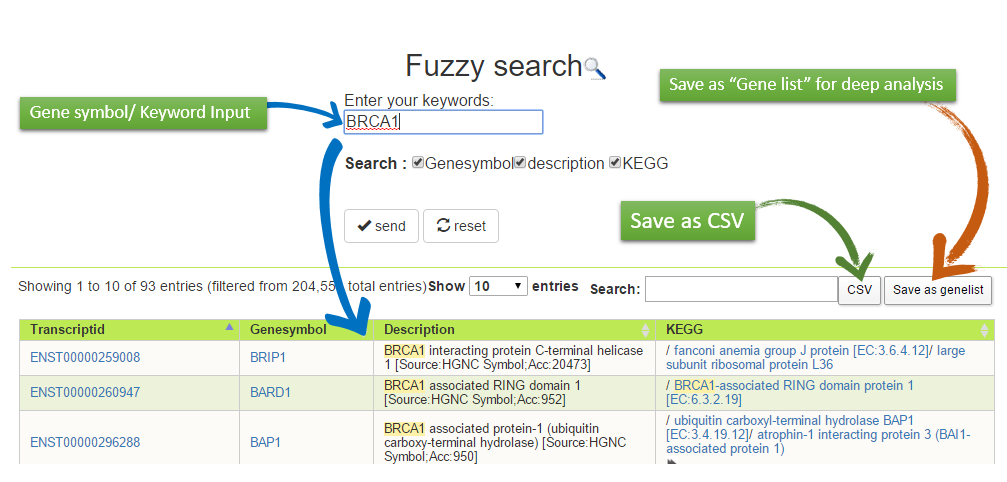
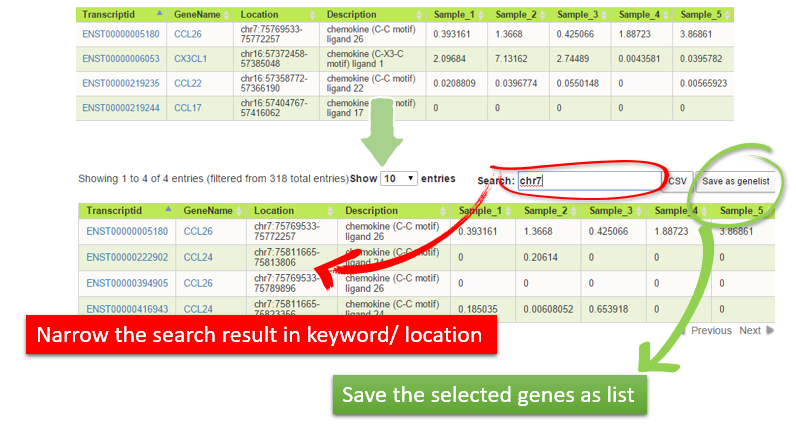
- Search the gene or any keyword you interest. It comes out the gene/ keyword appearing in GeneName, description, or KEGG.
- After clicking the buttom "send", user will get the output as below for more information and links.
- User can save the list as CSV to local machine or as "Gene list" for deep analysis in the tab named as "Gene List Analysis".
Library Comparison 
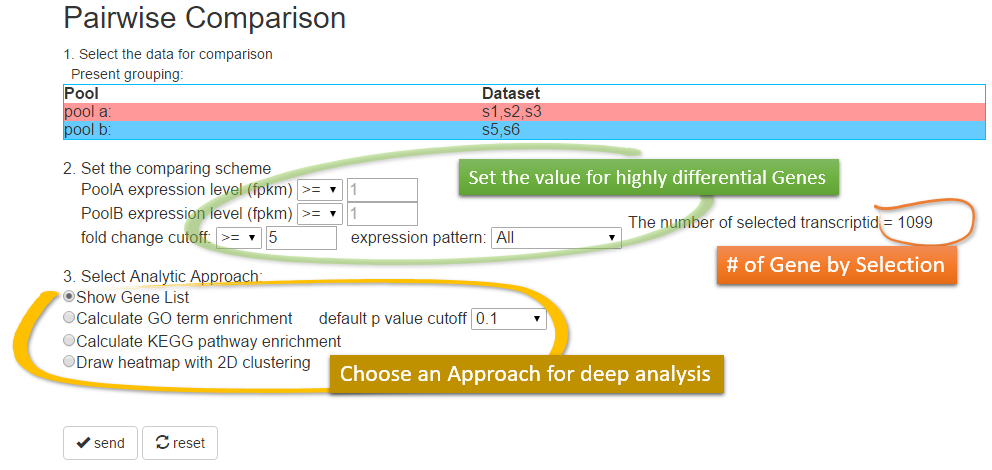
- Pairwise library comparison allows user to compare the difference between two groups.
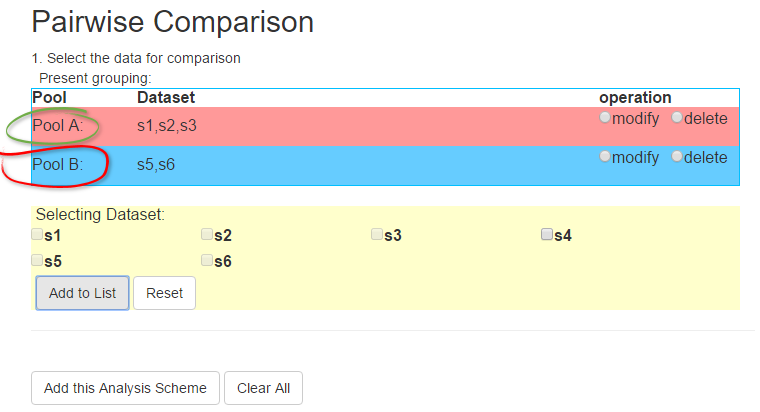
- Select libraries which you want to compare and analyze. If two or more libraries are selected in one group, the mean values are taken as the expression profile of this group. After set the comparing scheme, the number of selected genes will be shown. And then user can choose the approaches listed below for deep analysis.
- More about the Analytic Approaches.
Import GeneList 
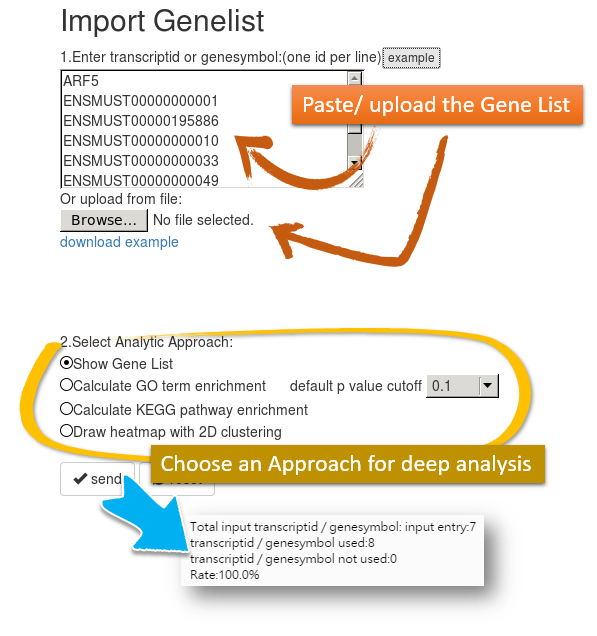
- In MOLAS, user can upload gene list in gene symbol and ENSEMBL transcript ID. And then MOLAS will give a report about the number of imported genes successfully. For example, we can import the cancer gene panel and save them as gene list to perform the calculation with other gene lists generated by different omic approaches. Meanwhile, user might start the analysis by selecting Analytic Approach.
Clustering
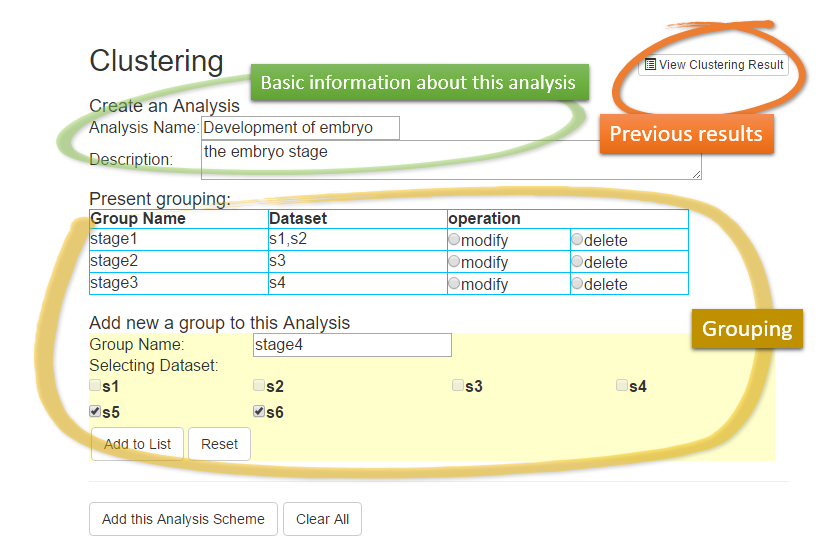
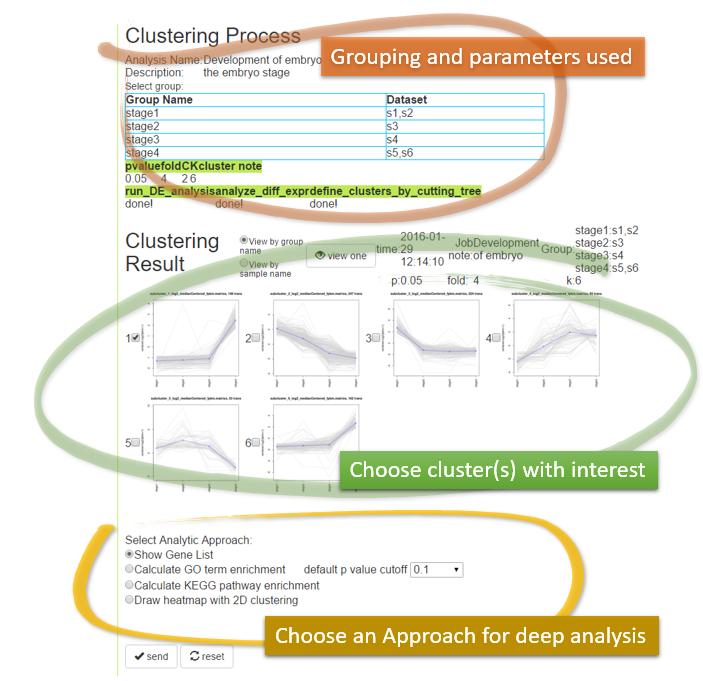
- According to the libraries imported, user can divide these libraries into several groups for clustering. And clicking the buttom "View Clustering Results", those results done before will be listed for retrieval.
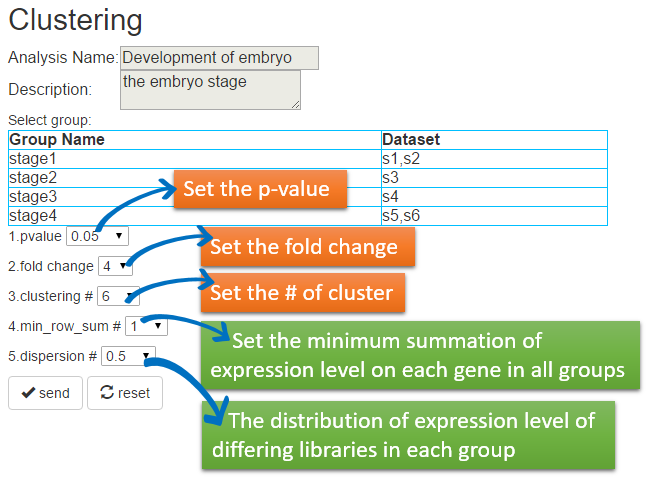
- After grouping and parameters setting for clustering, user may choose one or several clusters for deep analysis selecting Analytic Approach.
KEGG GlobalView 
- In MOLAS, we provide a view on specific pathway by integration of KEGG database. User can explore the different pathways to save all the genes belonged to specific pathway and jump into the map to check the methylation level on specific component (like enzyme 2.7.1.3 in the case below). In this way, it is easy to grasp those genes possesed of particular functions for deep analysis.

Gene List Analysis 
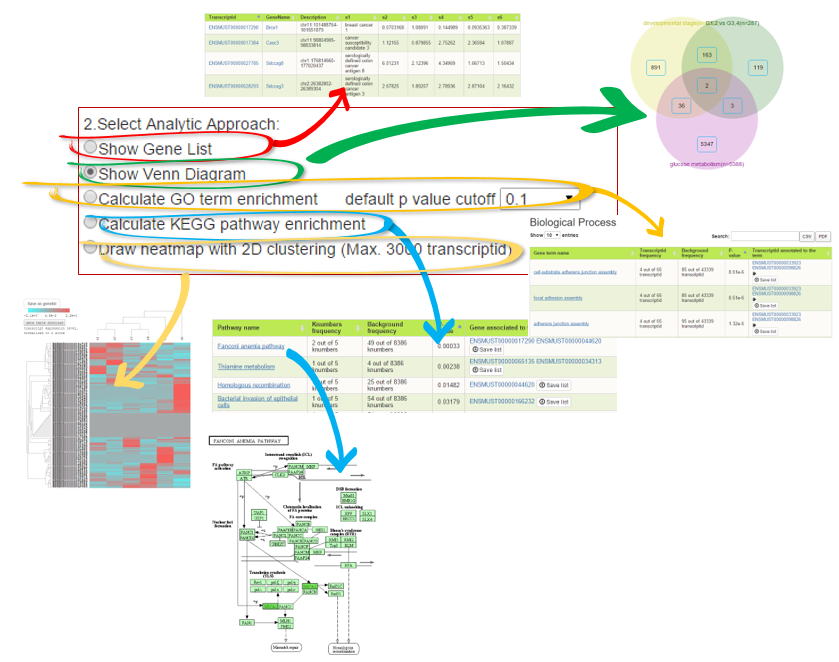
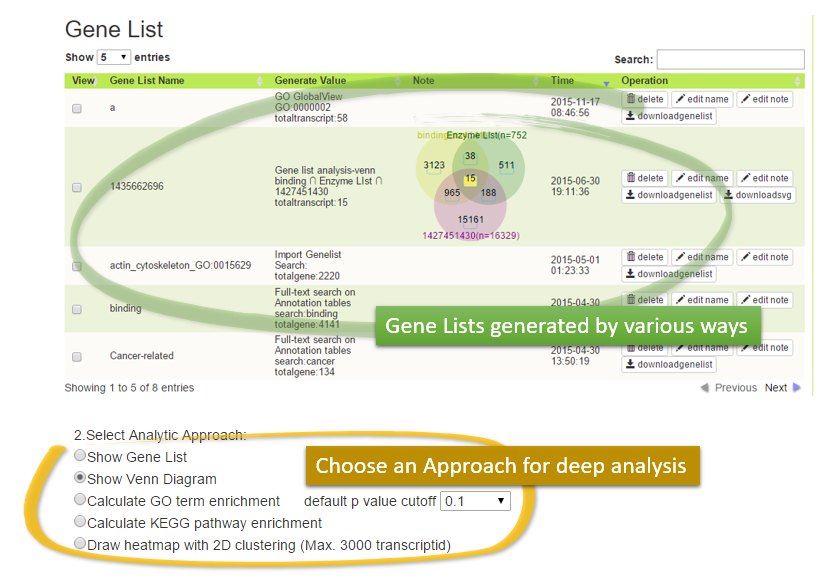
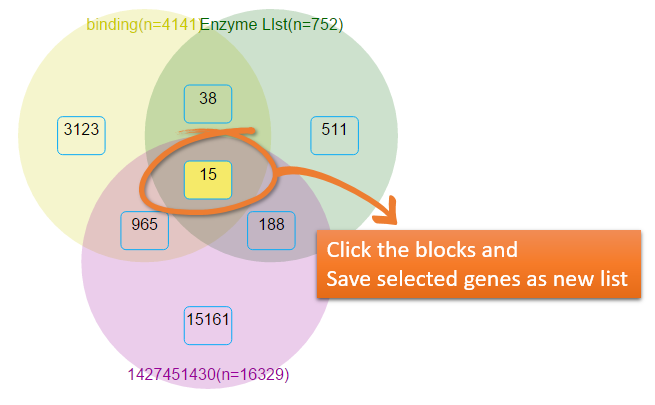
- According to different omic approaches used in MOLAS, we can generate many gene lists to close the core of research goal. All the lists with the notes about the ways them generated, are shown as below. User can select some of them to perform the deep analysis like showing gene list, performing logical operation in Venn diagram, calculating functional enrichment and plotting the heatmap.
Approaches for Deep Analysis 
In MOLAs, five major analytic approaches are ready for online analyses.
Show Gene list
Show Venn Diagram
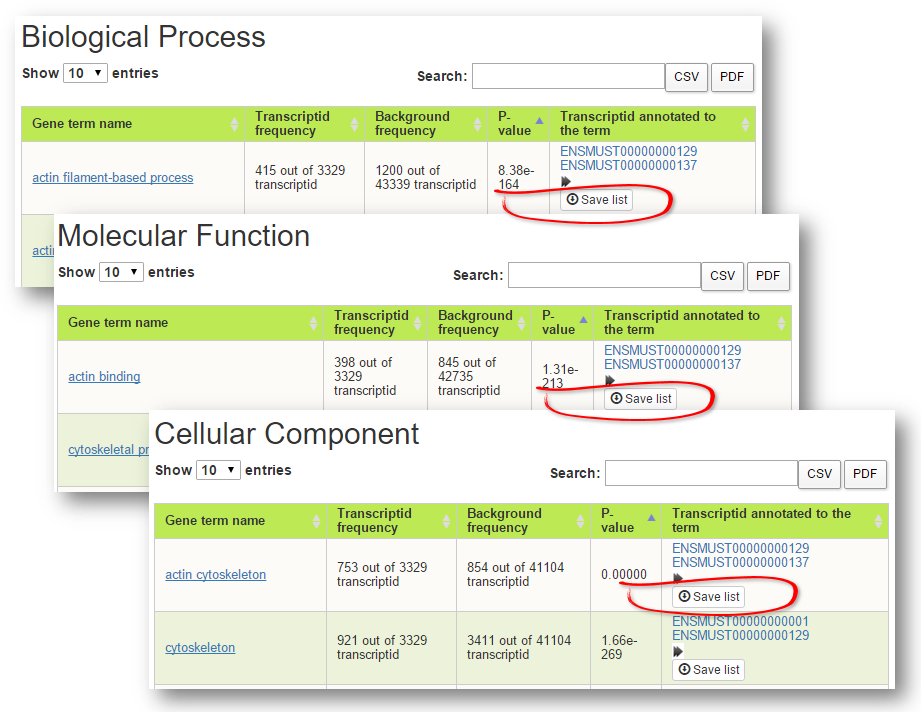
Calculate GO term enrichment 
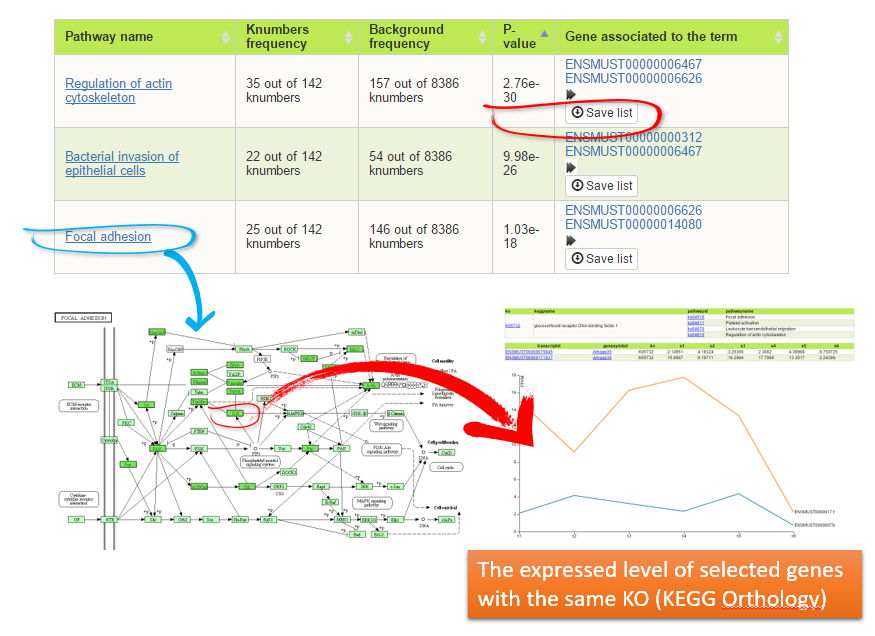
Calculate KEGG pathway enrichment
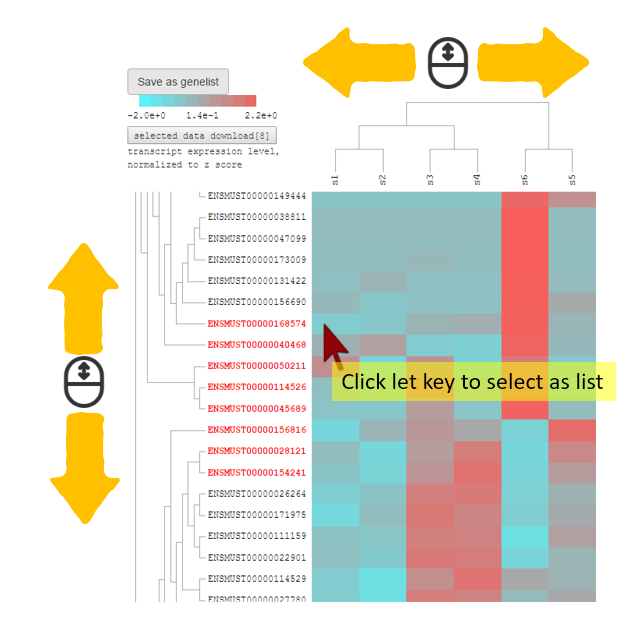
Draw heatmap with 2D clustering
